
Advanced Microfluidics Team
Scope
The Advanced Microfluidics Team focuses on the fundamental understanding and design of next-generation, high-performance, durable fuel-cell and electrochemical energy-storage devices, along with the physical characterization of their main components. The work in the group combines cutting-edge multiphysics, multiphase and multiscale modeling techniques with experimental diagnostic and visualization tools. The team actively collaborates with several research and academic institutions around the world. Current research areas include the modeling and experimental analysis of the complex and coupled multiphase mass-charge-heat transport phenomena and electrochemical kinetics that take place in the small scales of PEM Fuel Cells: hydrogen Polymer Electrolyte Fuel Cells (PEFCs), liquid-feed Direct Methanol Fuel Cells (DMFCs) and Direct Ethanol Fuel Cells (DEFCs).

News
- Pablo's PhD Thesis was awarded by UC3M as one of the best thesis presented in the Program of Mathematical Engineering during the 2015/16 academic year. His dissertation, supervised by Prof. Vera, dealt with the Multiphysics Modeling of Liquid-Feed Direct Methanol Fuel Cells and the Characterization of Diffusive Transport Properties of Gas Diffusion Layers. (UC3M Outstanding Thesis Awards)
- The group gave a talk at the VII International Conference on Coupled Problems in Science and Enginerring, 12–14 June 2017, Rhodes Island, Greece. (Abstract)
- The group gave two talks at the 11th European Fluid Mechanics Conference, 13–16 September 2016, Seville, Spain. (Abstracts)
Researchers
Collaborators
- Jeff T. Gostick. Associate Professor, Dept. of Chemical Engineering, McGill University, Montreal, Quebec, Canada.
- Adam Z. Weber. Principal Investigator, Energy Conversion Group, Lawrence Berkeley National Laboratory, Berkeley, California, USA.
- Iryna Zenyuk. Assistant Professor, Tufts University, Medford, Massachusetts, USA.
- Gisuk Hwang. Associate Professor, Wichita State University, Wichita, Kansas, USA.
- Daniel García-Sánchez. Senior Researcher, Institute of Engineering Thermodynamics, Electrochemical Energy Technology, Deutsches zentrum für Luft und Raumfahrt (DLR), Stuttgart, Germany.
- K. Andreas Friedrich. Head of Department, Institute of Engineering Thermodynamics, Electrochemical Energy Technology, Deutsches zentrum für Luft und Raumfahrt (DLR), Stuttgart, Germany.
- Ramón Zaera. Full Professor, Dept. of Continuum Mechanics and Structural Analysis, University Carlos III of Madrid, Leganés, Spain.
- Pierre Boillat. Scientist, Electrochemistry Laboratory and Neutron Imaging and Activation Group, Paul Scherrer Institut, Villigen, Switzerland.
Topics of interest
FEM Mechanical Modeling of PEM Fuel Cell Components
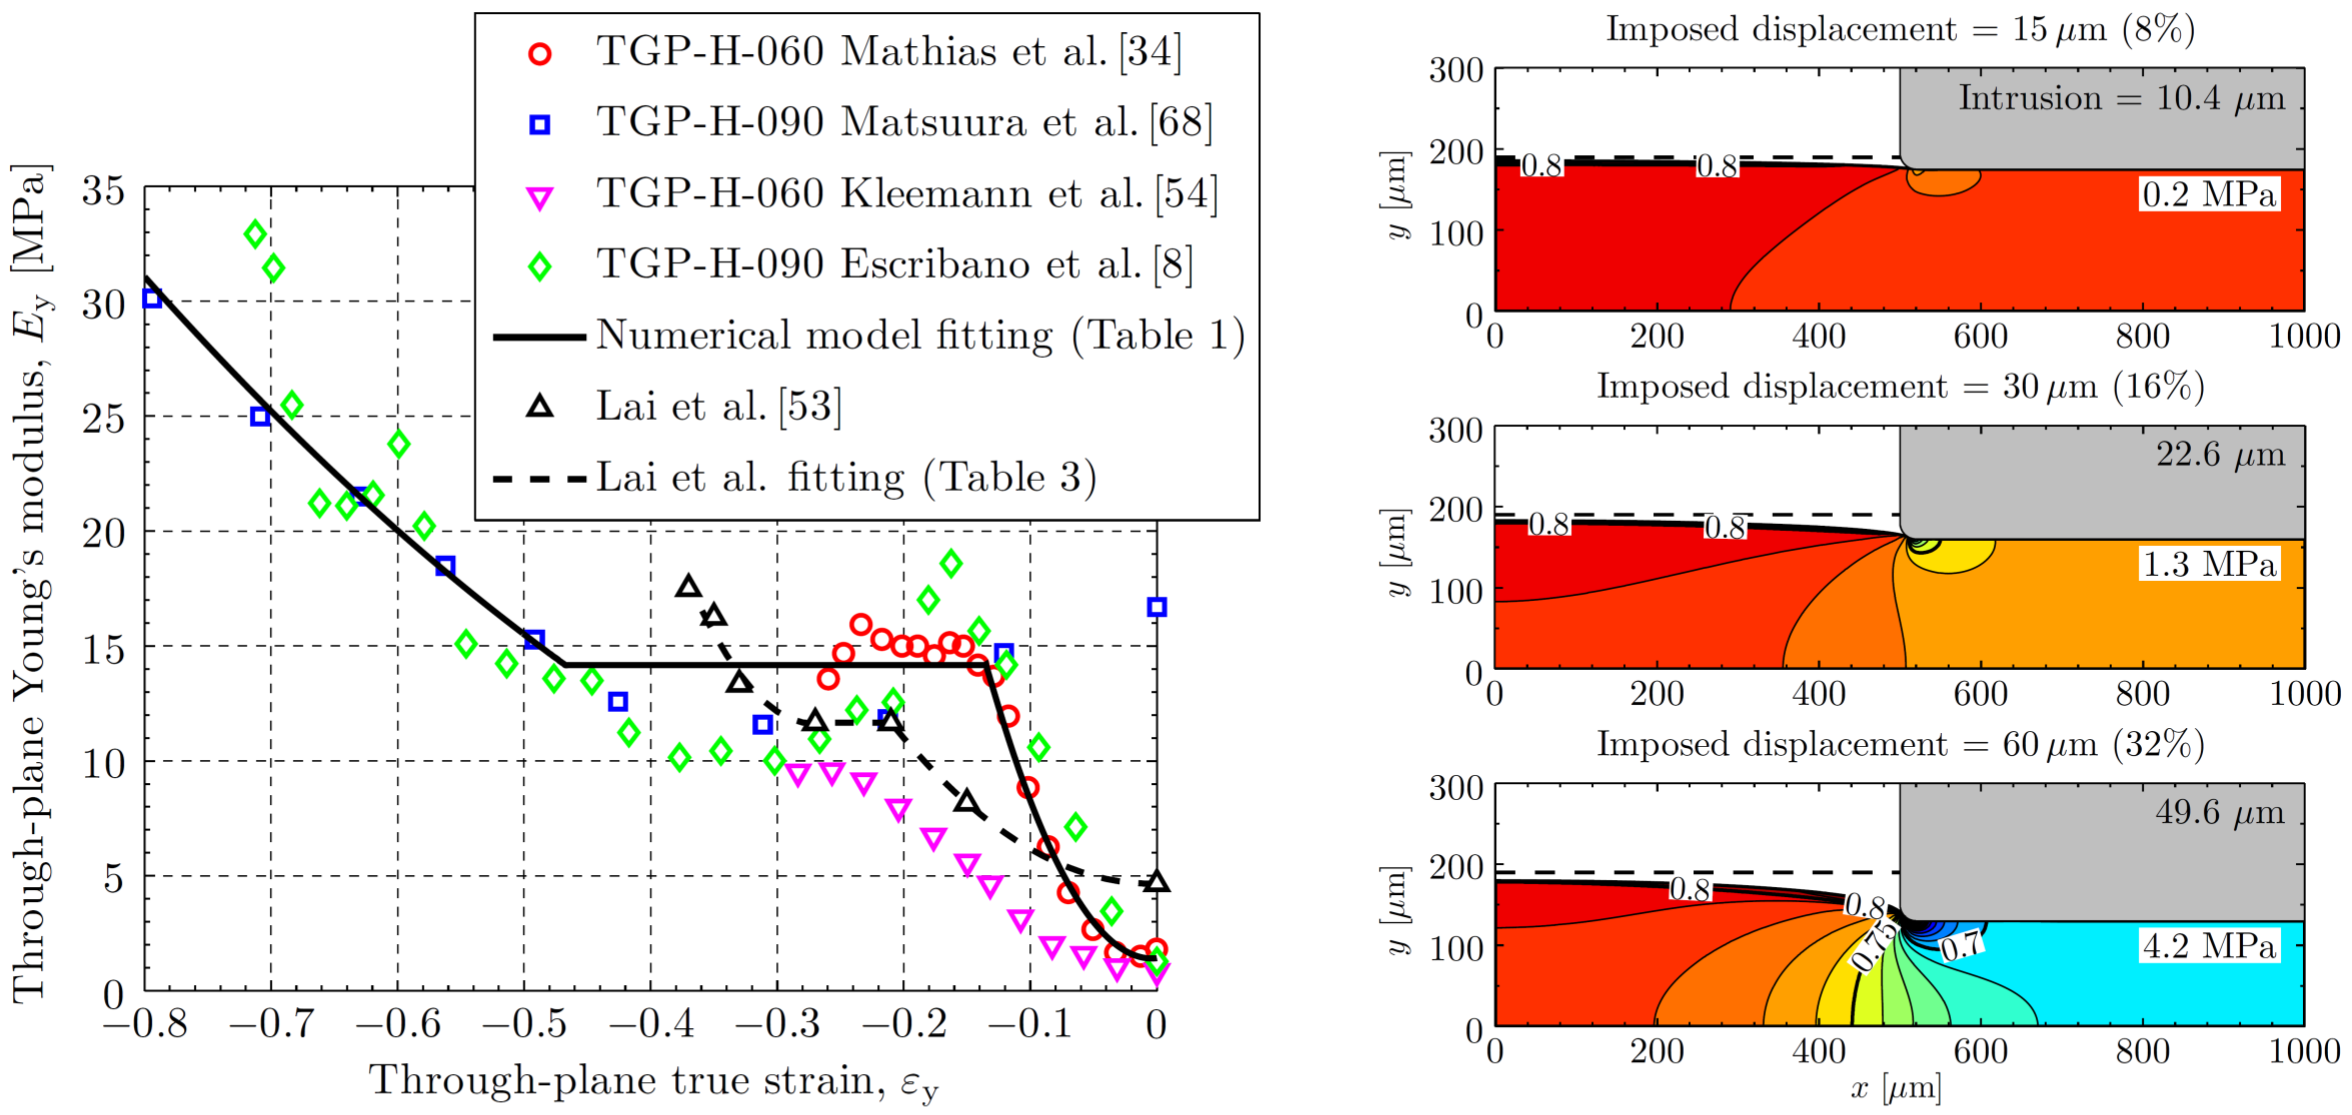
P. A. García-Salaberri, M. Vera, R. Zaera, Int. J. Hydrogen Energy 36 (2011) 11856–11870. (left) Nonlinear Toray carbon paper TGP-H-060/090 mechanical behavior in the through-plane direction calculated by numerical derivation of the true stress/strain curve obtained from the data reported by different authors. (right) Porosity field, GDL intrusion into the channel, and compression stress at the rib symmetry plane obtained for different imposed rib displacements (expressed both in mm and as a percentage of the initial GDL thickness of 190 um) and for an initial porosity of 0.8.
CFD Multiphysics Macroscopic Modeling of PEM Fuel Cells
- Hydrogen Proton Exchange Fuel Cells (PEFCs)

P. A. García-Salaberri, D. García-Sánchez, P. Boillat, M. Vera, K. A. Friedrich, Hydration-dehydration cycles in PEFCs operated with wet anode and dry cathode feed: A neutron imaging and modeling study, Under review. Schematic of the computational domain, showing the coordinate system, the anode and cathode terminals, the channel inlets and outlets, the cell components (PEM, CLs, MPLs, GDLs, channels, and BPPs), and the notation used for the geometrical parameters: (a) top view of the single-serpentine flow field, and (b) detailed cross-sectional view of the MEA and the rib/channel pattern of the bipolar plates. Drawing dimensions are not to scale.

P. A. García-Salaberri, D. García-Sánchez, P. Boillat, M. Vera, K. A. Friedrich, Hydration-dehydration cycles in PEFCs operated with wet anode and dry cathode feed: A neutron imaging and modeling study, Under review. (left) From top to bottom: computed distributions of liquid saturation in the anode channel, and relative humidity in the anode and cathode channels, corresponding to the low- and high-performance states of the hydration-dehydration cycles. The 2D-distributions were obtained by averaging the computed 3D fields in the through-plane direction (z-coordinate) at every point (x,y). The average value of the distributions is indicated at the top of each subplot. (right) From top to bottom: computed distributions of current density, membrane ionic resistance, and membrane temperature, corresponding to the low- and high-performance states.

D. García-Sanchez, T. Ruiu, K. A. Friedrich, J. Sánchez-Monreal, M. Vera, J. Electrochem. Soc. 163 (2016) F150–F159. Estimation of the global balance of water (BOW) in g/h at (a) 60ºC and (b) 80ºC. The reference conditions (50% RH at both anode and cathode) are indicated by a white cross. Color scale represents a qualitative behavior of the cell. Blue is used for high performances at stable condition, purple for flooding behavior, green for slight loose of performances with stable behavior and yellow for unstable behavior with deactivation. As shown, BOW at 60ºC is always positive and the cell behavior remains always stable. In contrast, at 80ºC BOW is negative for low cathode RH conditions which evidences unstable cell performances. Negative BOW levels have been substituted by lines that indicate the relative humidity of the outlet streams that gives zero BOW.
- Liquid-Feed Direct Methanol Fuel Cells (DMFCs)

P. A. García-Salaberri, M. Vera, Energy 113 (2016) 1265–1287. (left) Schematic of the computational domains covered by the 2D anode and cathode GDL models and the local 1D model (MPLs, PEM, and CLs), showing the x-y coordinate system, cell temperature, methanol and oxygen concentrations at the GDL/Channel interface, anode and cathode channel saturation levels, and the notation used for the geometrical parameters. The inset shows the electrochemical reactions modeled at the anode and cathode catalyst layers. (right) Schematic of the 3D/1D MEA + 1D channel liquid-feed DMFC model. 1D models for the anode and cathode channels are coupled to the 3D/1D MEA model at each downstream station to account for the downstream variation of the different flow variables.

P. A. García-Salaberri, M. Vera, I. Iglesias, J. Power Sources 246 (2014) 239–252. Computed gas-void fraction distributions for different gas coverage factors at the GDL/Channel interface.
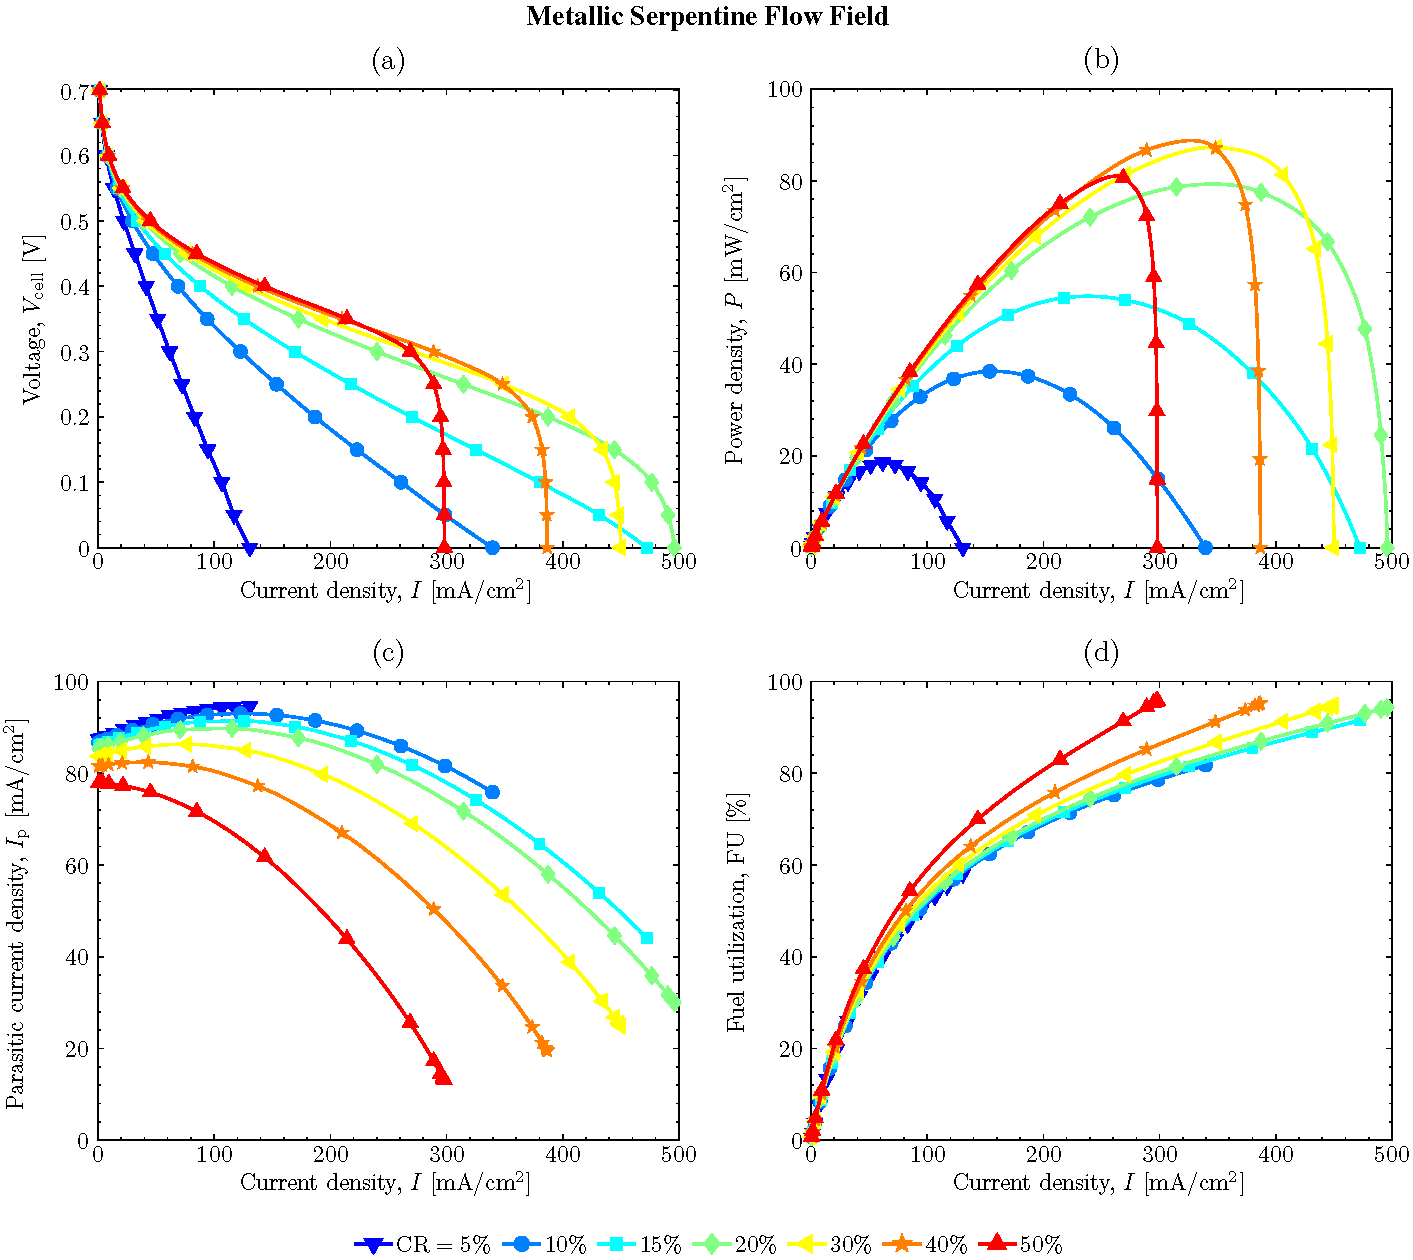
P. A. García-Salaberri, M. Vera, J. Power Sources 285 (2015) 543–558. Computed cell performance at various GDL compression ratios, CR, for the serpentine flow field of stainless steel (metallic): (a) cell voltage, (b) power density, (c) parasitic current density, and (d) fuel utilization, as a function of cell current density. Reference markers are plotted at intervals of 50 mV.

P. A. García-Salaberri, M. Vera, Energy 113 (2016) 1265–1287. Computed cell performance as a function of methanol concentration at the GDL/channel interface and cell temperature: (a) and (b) output power density and parasitic current density, and (c) polarization curves corresponding to two specific methanol concentrations and various cell temperatures. The oxygen concentration is equal to 6 mol/m3.
- Direct Ethanol Fuel Cells (DEFCs)

J. Sánchez-Monreal, P. A. García-Salaberri, M. Vera, ECS Trans. 72 (2016) 1-16. Schematic representation of the physical domains covered by the 1D across- and 1D along-the-channel models, showing the inlet conditions, the channel/rib dimensions, and the thickness of the different layers of the MEA. Left: side view, right: cross-sectional view.

J. Sánchez-Monreal, P. A. García-Salaberri, M. Vera, ECS Trans. 72 (2016) 1-16. Anode overpotential measured experimentally by previous authors and computed by the present model. Operating conditions: 1M ethanol feed concentration, 70ºC.
Pore-Scale Modeling of PEM Fuel Cells and Characterization of Effective Transport Properties

P. A. García-Salaberri, G. Hwang, M. Vera, A. Z. Weber, J. T. Gostick, Int. J. Heat Mass Transf. 86 (2015) 319–333. (a) Computational domain used for effective gas diffusivity calculations with the LBM, showing the different elements of the system. (b) and (c) Computed concentration fields corresponding to simulations in the in- and through-plane directions, respectively. The resolution of the 1.3x1.3x0.28 mm 10% PTFE-treated GDL domain was downscaled by a factor 3x3x1 to avoid memory limitations of the 48 GB rendering workstation.

P. A. García-Salaberri, J. T. Gostick, G. Hwang, A. Z. Weber, M. Vera, J. Power Sources 296 (2015) 440–453. (a) Schematic of the methodology used to compute functional relationships for the local dry and relative effective diffusivities on local porosity and local saturation, respectively. LB simulations were performed on XCT images of arbitrarily selected subdomains that are representative of the GDL microstructure, and have nearly uniform porosity and saturation distributions. The rendered image stack corresponds to the breakthrough point. The direction of water injection in the invasion experiments is indicated. (b) and (c) Representative elementary volume (REV) determinations of (b) porosity, and (c) water saturation at the breakthrough point for Toray TGP-H-120 carbon paper. The y-axis shows the range of values calculated inside randomly drawn boxes of different thickness as indicated on the x-axis; the length in the material plane is kept equal to 0.4 mm. For the analysis of the porosity the outer high-porosity surface regions of the GDL were included, while for the water saturation only the core region was considered. The unrepresentative microscopic scale (highly influenced by the granularity of the material) and the representative macroscopic scale (leading to consistent functional relationships for the effective diffusivity) are clearly identified in (b).

P. A. García-Salaberri, J. T. Gostick, G. Hwang, A. Z. Weber, M. Vera, J. Power Sources 296 (2015) 440–453. (left) Computed local relative effective diffusivity for (a) the through-plane (TP), and (c) the in-plane (IP) direction, as a function of local average saturation. The results are marked with hollow symbols according to the thickness of the subdomains in the LB simulations, including the best fit to a power law. (right) Distribution of the power-law exponent, associated to each data point presented on the left panel for (b) the TP, and (d) the IP direction.
Experimental Analysis of PEM Fuel Cells
- Hydrogen Proton Exchange Fuel Cells (PEFCs)

P. A. García-Salaberri, D. García-Sánchez, P. Boillat, M. Vera, K. A. Friedrich, Hydration-dehydration cycles in PEFCs operated with wet anode and dry cathode feed: A neutron imaging and modeling study, Under review. (a) Variation of the average current density and high-frequency resistance as a function of time, after a change of the cathode stream from fully-humidified to non-humidified conditions, while keeping the anode stream fully humidified. (b) Distributions of liquid water thickness from through-plane neutron imaging experiments (top view) at different times during a hydration-dehydration cycle. The active area of the cell and the anode inlet chamber are indicated by red dashed lines; the cathode inlet is located at the diametrically opposite corner. Membrane material: Nafion 111. The subfigure in the frame shows the current density distributions during a hydration-dehydration cycle previously obtained in a segmented cell by Sánchez et al. (J. Electroanal. Chem. 649 (2010) 219-231).

D. García-Sanchez, T. Ruiu, K. A. Friedrich, J. Sánchez-Monreal, M. Vera, J. Electrochem. Soc. 163 (2016) F150–F159. Relation between RH and cell performance stability. Squares represent the combination of RH conditions at anode and cathode adopted during the different experiments. Purple is used for flooding behavior, blue for high performances at stable condition, green for slight loss of performances with stable behavior, and orange for unstable behavior with deactivation.
- Liquid-Feed Direct Methanol Fuel Cells (DMFCs)

Polarization curves corresponding to different methanol feed concentrations. Other operating conditions: 80 ºC cell temperature, 5 cl/min anode flow rate, and 2 l/min cathode flow rate.
Publications
- P. A. García-Salaberri, M. Vera, On the effect of operating conditions in liquid-feed DMFCs: A multiphysics modeling approach, Energy 113 (2016) 1265–1287.
- J. Sánchez-Monreal, P. A. García-Salaberri, M. Vera, Mathematical Modeling of Direct Ethanol Fuel Cells Using a Multi-Step Chemical Kinetic Mechanism, ECS Trans. 72 (2016) 1-16.
- D. García-Sanchez, T. Ruiu, K. A. Friedrich, J. Sánchez-Monreal, M. Vera, Analysis of the Influence of Temperature and Gas Humidity on the Performance Stability of Polymer Electrolyte Membrane Fuel Cells, J. Electrochem. Soc. 163 (2016) F150–F159.
- P. A. García-Salaberri, J. T. Gostick, G. Hwang, A. Z. Weber, M. Vera, Effective diffusivity in partially-saturated carbon-fiber gas diffusion layers: Effect of local saturation and application to macroscopic continuum models, J. Power Sources 296 (2015) 440–453.
- P. A. García-Salaberri, G. Hwang, M. Vera, A. Z. Weber, J. T. Gostick, Effective diffusivity in partially-saturated carbon-fiber gas diffusion layers: Effect of through-plane saturation distribution, Int. J. Heat Mass Transf. 86 (2015) 319–333.
- P. A. García-Salaberri, M. Vera, On the effects of assembly compression on the performance of liquid-feed DMFCs under methanol-limiting conditions: A 2D numerical study, J. Power Sources 285 (2015) 543–558.
- D. García-Sánchez, T. Ruiu, I. Biswas, K. A. Friedrich, J. Sánchez-Monreal, M. Vera, Effect of the Inlet Gas Humidification on PEMFC Behavior and Current Density Distribution, ECS Trans. 64 (2014) 603–617.
- P. A. García-Salaberri, M. Vera, I. Iglesias, Modeling of the anode of a liquid-feed DMFC: inhomogeneous compression effects and two-phase transport phenomena, J. Power Sources 246 (2014) 239–252.
- P. A. García-Salaberri, M. Vera, R. Zaera, Nonlinear orthotropic model of the inhomogeneous assembly compression of PEM fuel cell gas diffusion layers, Int. J. Hydrogen Energy 36 (2011) 11856–11870.
- M. Vera, A single-phase model for liquid-feed DMFC cells with non-Tafel kinetics, J. Power Sources, 171 (2007) 763–777.
Research projects
- Multiphysics modeling of water management phenomena in PEM fuel cells (project EN2015‐68703‐C2‐1‐R of the Spanish Ministerio de Economía y Competitividad).

Links of interest
- OpenPNM: An Open Source Pore Network Modeling Package.
- OpenFCST: Open-Source Fuel Cell Simulation Toolbox.
- Energy Systems Design Laboratory (University of Alberta).
- Fuel Cell Systems and Diagnostics (Paul Scherrer Institut).
- International Center for Numerical Methods in Engineering.
- Spanish Fuel Cell Association.
- Toyota Mirai–The Turning Point.
Pictures
VII International Conference on Coupled Problems in Science and Engineering (June 2017, Rhodes Island, Greece)


Pablo and Marc Secanell attending a plenary lecture.
Pablo and Marc Secanell attending a plenary lecture.

Coffee break. From left to right: Marc Secanell, Jordi Pons-Prats and Pablo.
11th European Fluid Mechanics Conference (September 2016, Seville, Spain)

Welcome cocktail. From left to right: Jeff Gostick, Pablo García-Salaberri, and Juan Sánchez-Monreal.

Leaving the congress. From left to right: Marcos Vera, Juan Sánchez-Monreal, and Pablo García-Salaberri.